
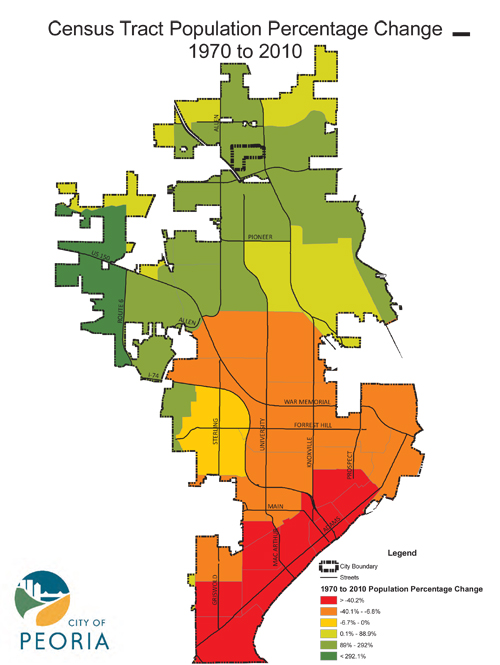
From the City’s Planning and Growth Department, here are a couple of pictures that show the migration of Peoria’s population from the older neighborhoods to the south into the newer neighborhoods to the north. Areas in red and orange saw a decline in population, whereas areas in yellow and green saw an increase. As you look at these, take particular note of how large the area is that is losing population versus the area that is gaining population. Here’s a map that shows the change just over the past ten years:
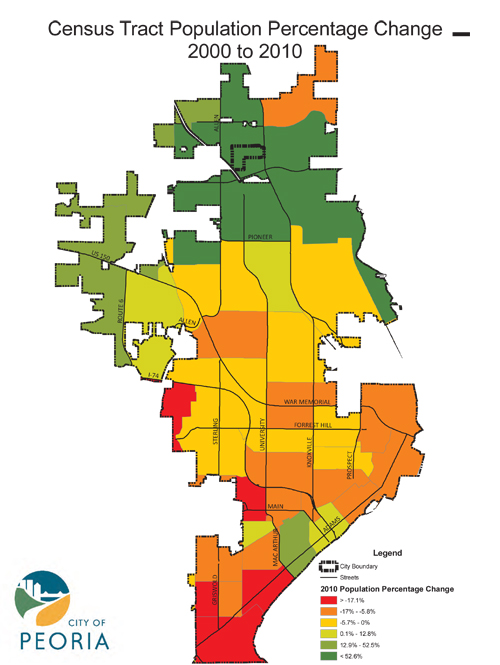
And here’s what the change looks like over the past forty years:
Here are some other revealing statistics:
| Year | Population | Area |
|---|---|---|
| 1970 | 126,963 | 40 mi.2 |
| 2010 | 115,007 | 49.84 mi.2 |
That means that, over the past 40 years, there has been a 9.42% drop in population, and a 24.6% increase in land area that has been annexed into the City. In other words, our city has gotten physically bigger, but the burden of providing city services to all that land is falling on fewer taxpayers.
Now, to be fair, we had large population losses from 1970 to 2000, but have seen a slight population gain between 2000 and 2010. So let’s compare just the changes in the past ten years. Population increased from 112,936 to 115,007, or 1.83%, yet land area grew from 44 to 49.84 square miles, or 13.27%. If it takes over 13% growth in land to net a little under 2% growth in population, I would submit that we cannot sustain such a policy.
These charts illustrate that we have to find ways to get people moving back into our heritage neighborhoods. Northern growth alone is demonstrably insufficient to pull the city out of its fiscal crisis.