![]() Ross Black, Assistant Planning Director for the City of Peoria, has released the results of the Comprehensive Plan online survey. You can read the summary results here (PDF file); more details will be released in the near future.
Ross Black, Assistant Planning Director for the City of Peoria, has released the results of the Comprehensive Plan online survey. You can read the summary results here (PDF file); more details will be released in the near future.
Take a look at them and tell me what you think. Here are some things I thought were interesting or notable:
- The one-to-ten scale is inverted — lower numbers indicate higher satisfaction or importance and vice versa.
- They’re still saying that lower scores indicate that something is “not important.” I think that’s misleading, as I’ve explained in this earlier post.
- Survey-takers’ satisfaction with Peoria as a place to live is decidedly middling: 4.2. In other words, “so-so.”
- Not surprising was that the top two districts to respond to the survey were the fifth and second districts (29% and 21%, respectively).
- Very surprising was how many people took the survey who don’t even live in Peoria (18%) — they were actually the third highest group! Gee, thanks for the input, interlopers. I suppose one could make the argument that these are people who have businesses or rental properties in the city, but who personally live outside the city. If so, then the high percentage is even more disturbing.
- Lowest district representation: first (5%). This is not surprising. The first district includes predominantly lower-income residents, many of whom presumably cannot afford computers and internet access, and even if they can, don’t have the time to spend filling out surveys. There are also a lot of renters who presumably would not have as much interest in the city’s comprehensive planning process. Many may also just simply feel disenfranchised — like nobody cares about their opinions anyway.
- 93% of respondents were white, 5% were black, 1% were Asian, 1% were “other,” and less than 1% were Native American. According to the 2000 census, 69.3% of Peorians were white, 24.8% were black, 2.3% were Asian, less than 1% were “American Indian.”
- The higher the income, the more people responded. 80% of respondents had a household income of over $50,000. 20% of respondents had household income less than $50,000. Median household income in 1999, according to the census: $36,397.
- 35% of respondents would “like to live within walking distance from downtown and the riverfront.” That’s a little more than one out of every three respondents — a significant number.
- The number one item under Public Health and Human Services: “Provide youth services that guide children toward good behavior.” Wow. Apparently it takes a government to raise a child. When I was a kid, we had parents to guide children toward good behavior. Now we need “youth services” provided by the city.
Your turn. What are your thoughts on the results?

 I guess we may as well just pitch the Land Development Code. It doesn’t appear that city commissions have any interest in actually enforcing it.
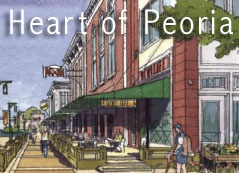 I thought you might be interested to know what’s going on with the Heart of Peoria Commission these days. Here’s a quick look: